Annual Budget and Net Worth Tracker
$14 · Excel (.xlsx), works in Google Sheets and Numbers
Buy for $14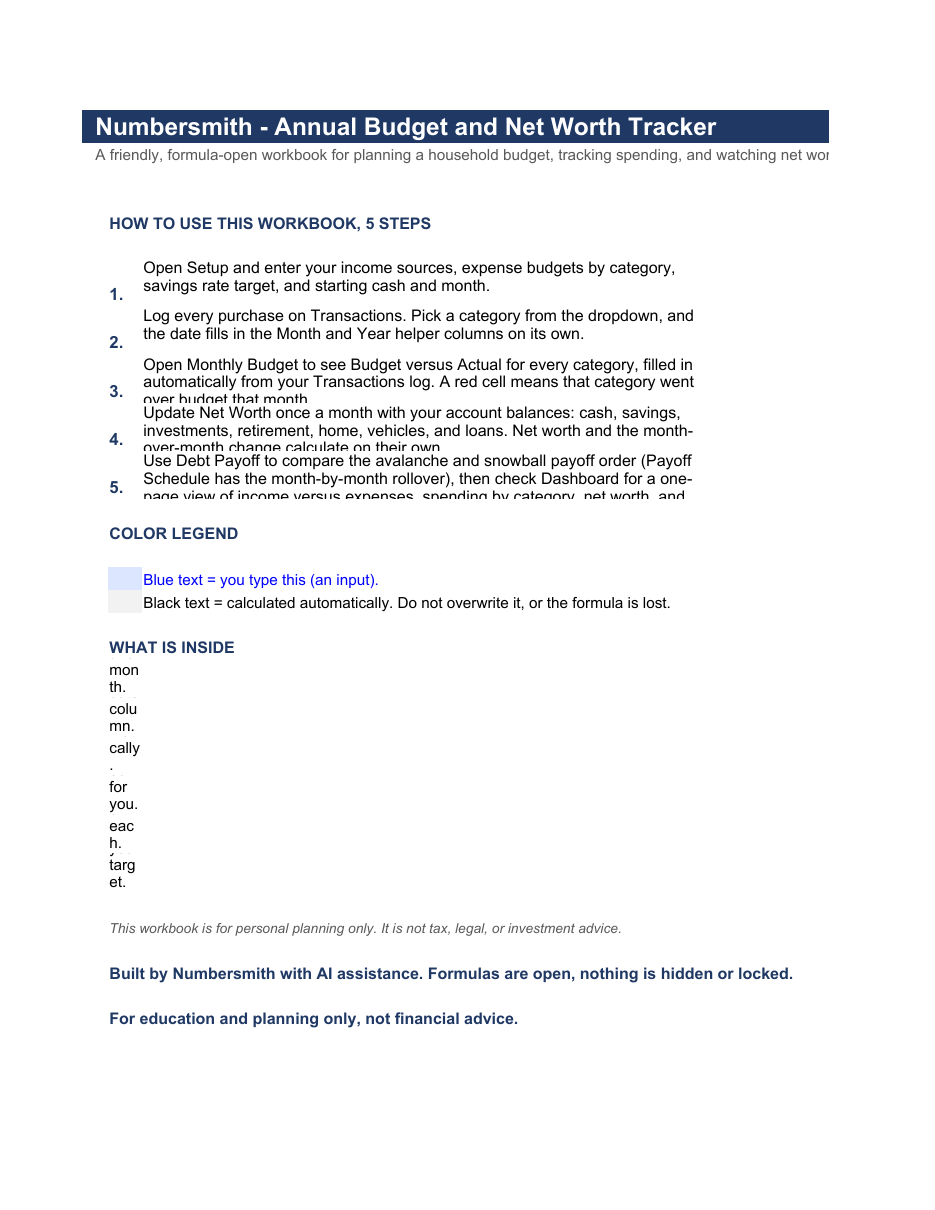


Description
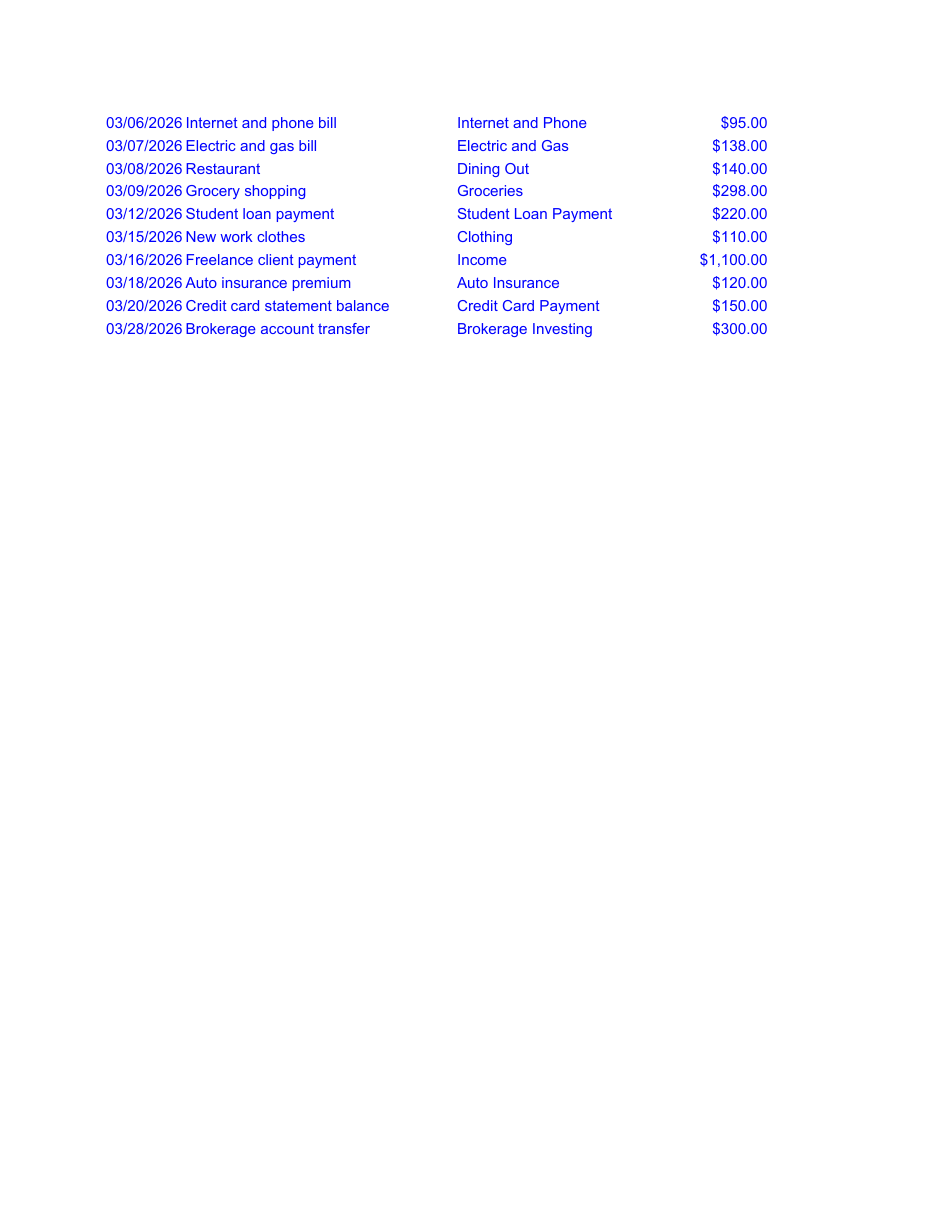
Most budget spreadsheets stop working once you stop typing Actual numbers by hand. This one is built around a transaction log. You type each purchase once and the rest of the workbook fills in on its own.
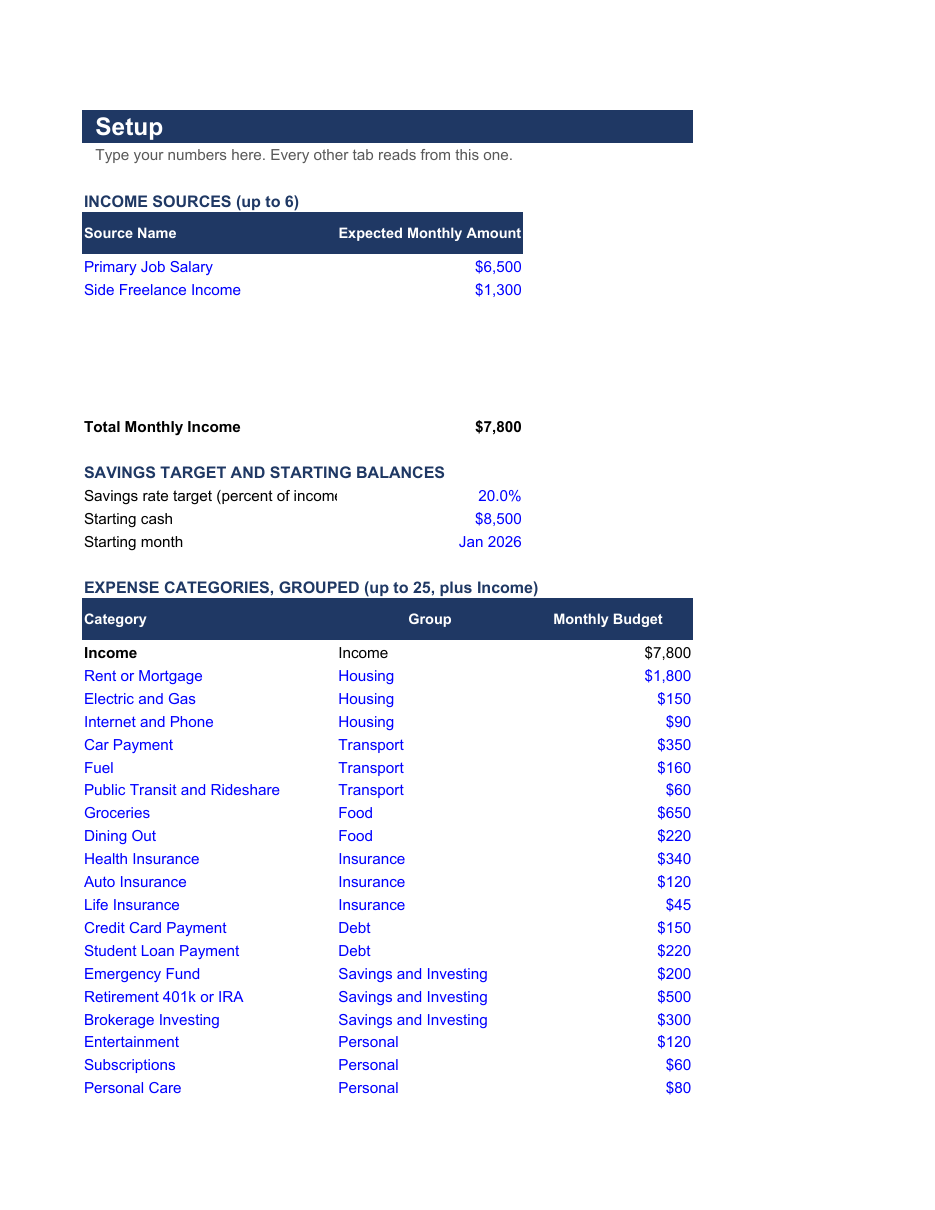
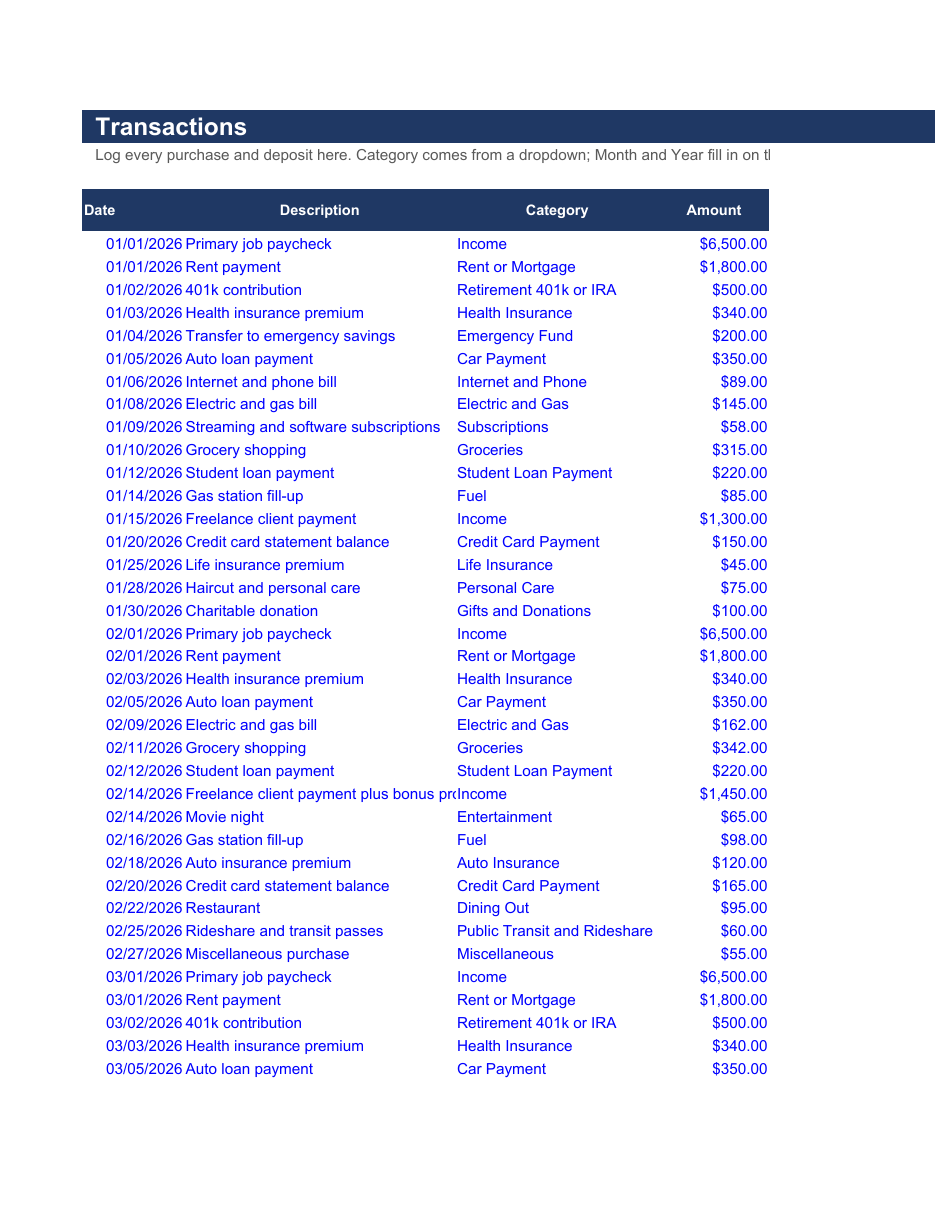
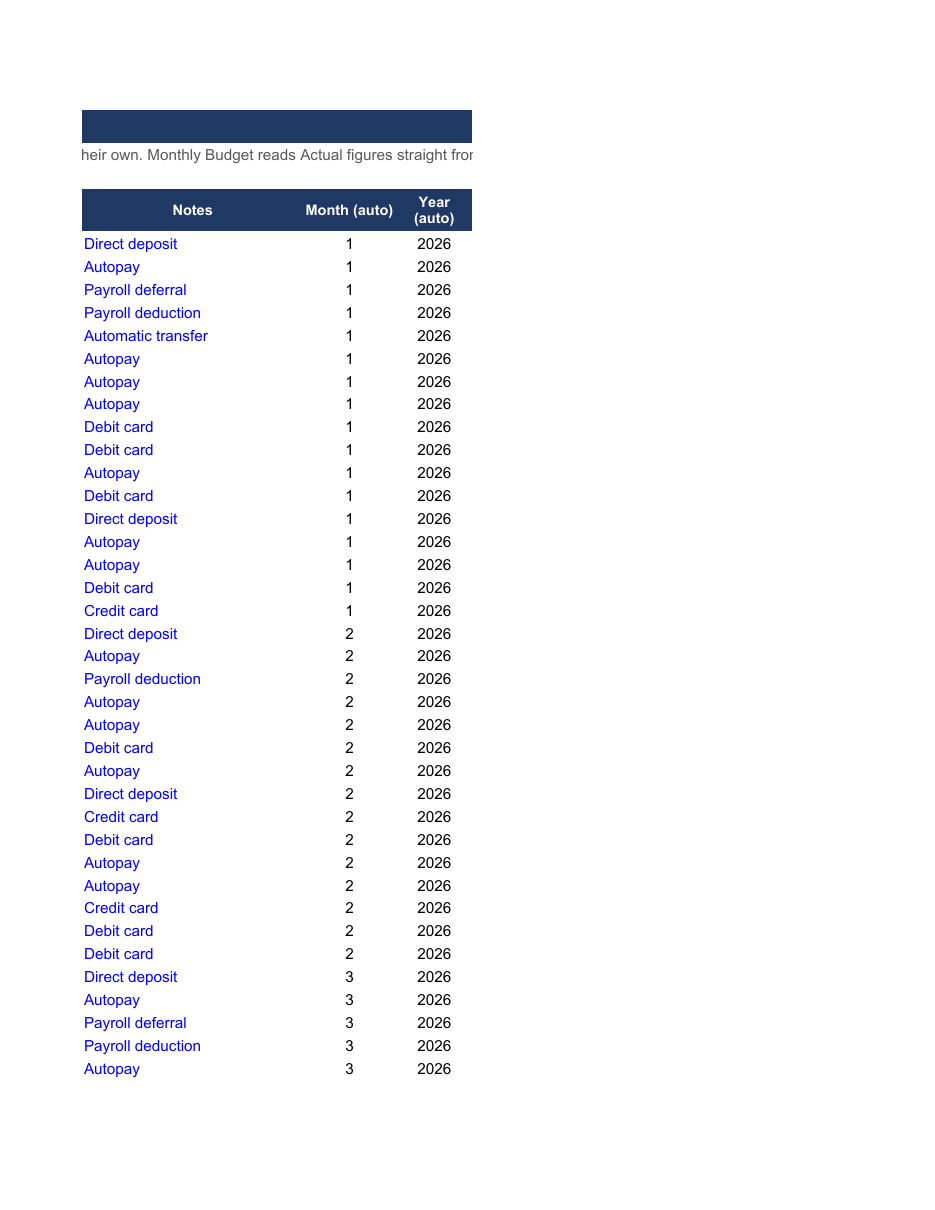
Type your income sources, category budgets, and savings rate target into Setup. Then log every purchase and paycheck on Transactions and pick a category from a dropdown. Monthly Budget reads that log and shows Budget versus Actual for every category across 12 months. It has a year-to-date column and turns a category red in any month it goes over.
Net Worth tracks seven asset lines and five liability lines by month. It calculates net worth and the month-over-month change and colors the change green or red.
Debt Payoff ranks up to six debts under the avalanche method (highest rate first) and the snowball method (smallest balance first). Payoff Schedule runs both plans month by month for up to 30 years with true rollover. When one debt is paid off, its payment moves to the next one in line. You see the real debt-free month and the total interest for each plan, so you know what avalanche saves over snowball for your numbers.
Dashboard puts it on one page with four charts. They cover income versus expenses, spending by category group, net worth over the year, and savings rate against your target.
Built with AI assistance and formula-checked. Every number that is not an input is a live formula you can trace back to its source. Nothing is hidden, locked, or protected. It opens with three months of sample transactions for a fictional household earning about $7,800 a month, so you can see how it works before you enter your own.
Works in Excel, Google Sheets, and LibreOffice Calc. Delivered as a single .xlsx file, instant digital download, no physical product ships.
For education and planning only, not financial advice.
What is inside
- Start Here: a 5-step guide, a color legend, and a plain-English map of what each tab does
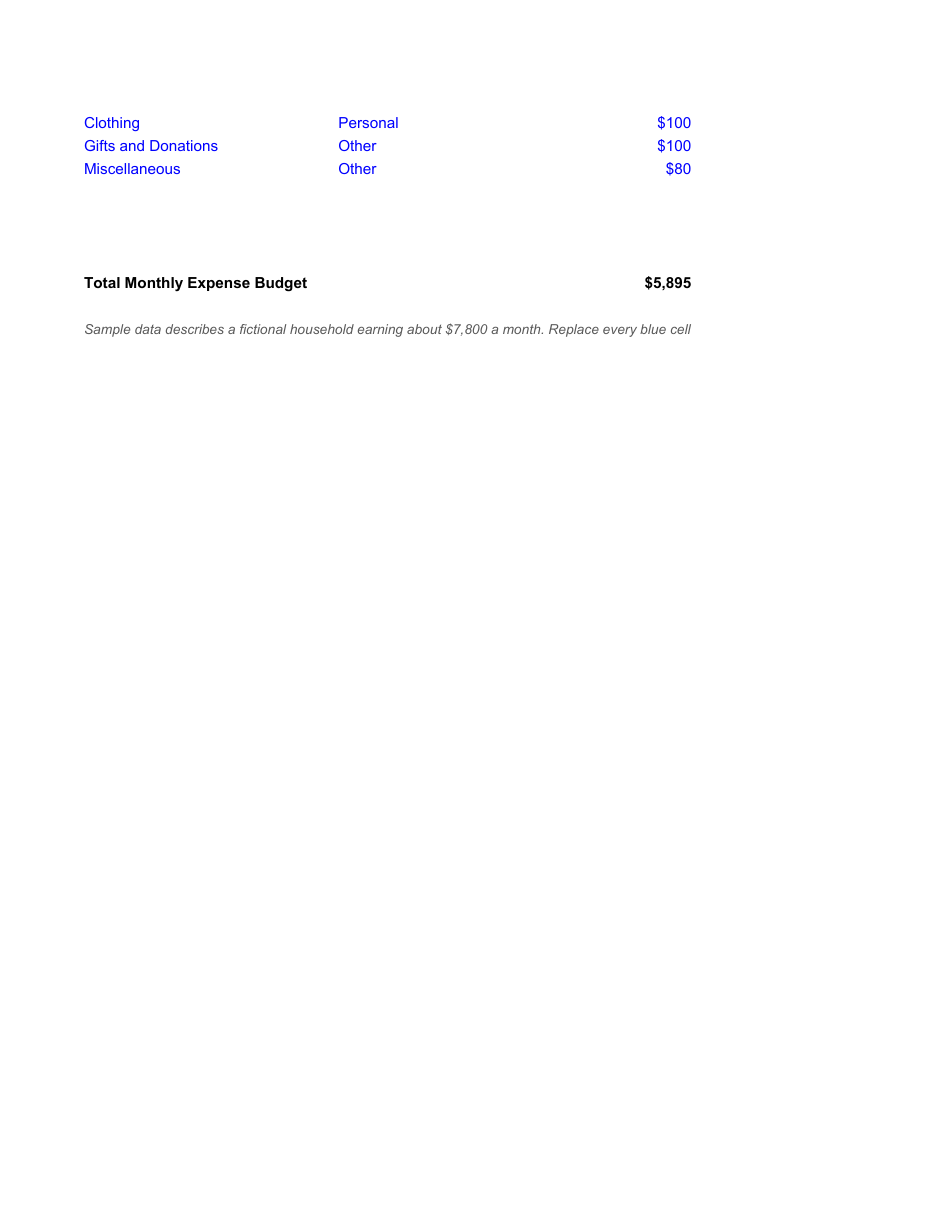
- Setup: up to 6 income sources, up to 25 expense categories grouped into Housing, Transport, Food, Insurance, Debt, Savings and Investing, Personal, and Other, a savings rate target, and starting cash and month
- Monthly Budget: Budget, Actual, and Difference for every category across 12 months, filled in automatically from Transactions, with income, expenses, net, savings rate, a year-to-date column, and red highlighting for any month you went over budget
- Transactions: a 500-row log with a category dropdown; this is the only tab where you type your day-to-day spending
- Net Worth: cash, savings, investments, retirement, home, vehicles, and other assets against mortgage, auto loan, student loans, credit cards, and other liabilities, by month, with net worth and month-over-month change calculated and color-coded
- Debt Payoff: up to 6 debts ranked automatically for the avalanche and snowball strategies, with a per-debt payoff month and a Rollover Plan block showing the debt-free month, total interest, and total paid under each strategy side by side
- Payoff Schedule: the month-by-month rollover behind those numbers, for both strategies across up to 360 months, with each debt's balance, minimum, and payment every month and the extra pool cascading to the next debt as each one is cleared
- Dashboard: a one-page view with 4 charts covering income versus expenses, spending by category group, net worth over the year, and savings rate versus target