Rental Property Analyzer (Cash Flow, ROI, 10-Year IRR)
$24 · Excel (.xlsx), works in Google Sheets and Numbers
Buy for $24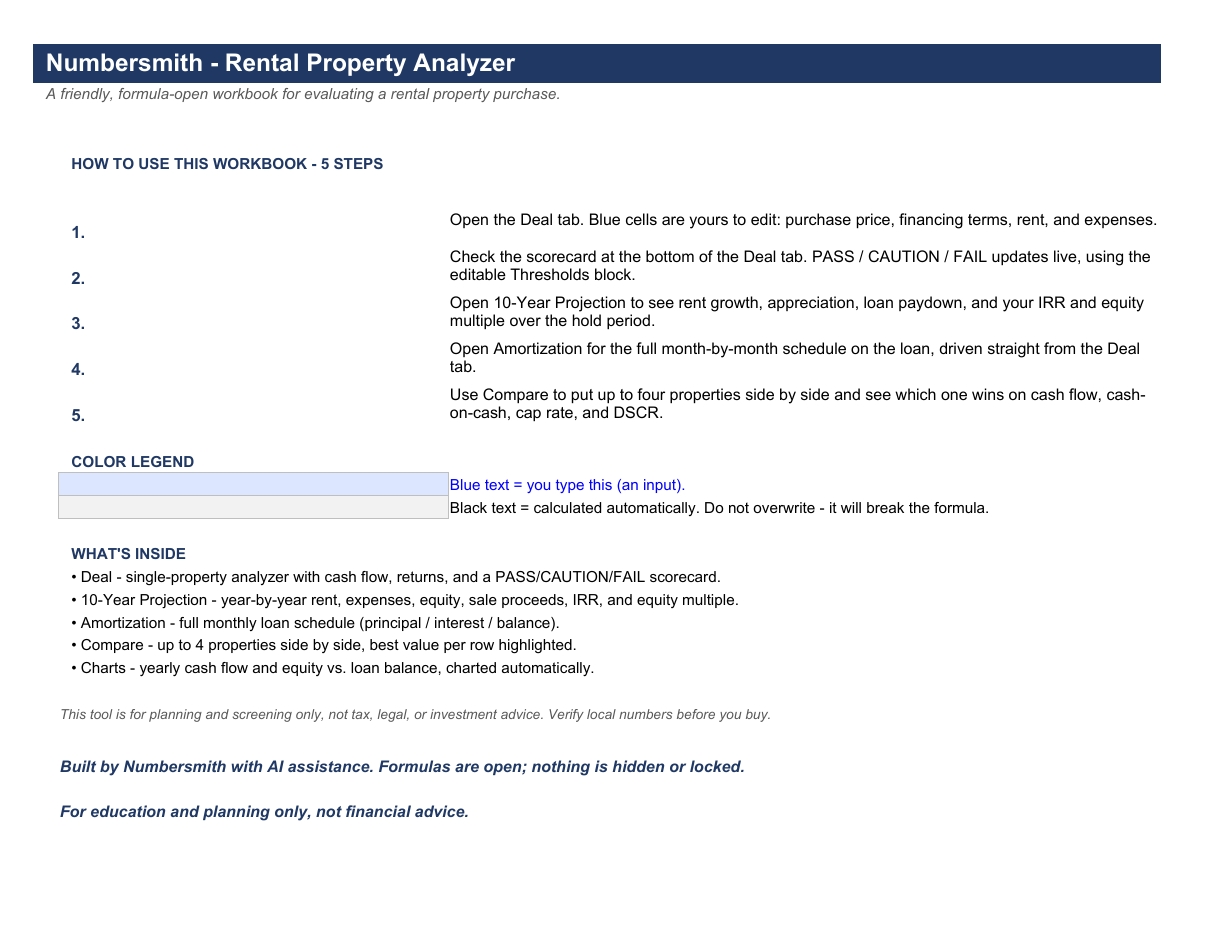
Description
Find out if a rental deal works before you make an offer. You enter the price, the loan, the rent and the expenses. The workbook returns monthly cash flow, cap rate, cash-on-cash return and DSCR. A PASS, CAUTION or FAIL scorecard sums it up at a glance.
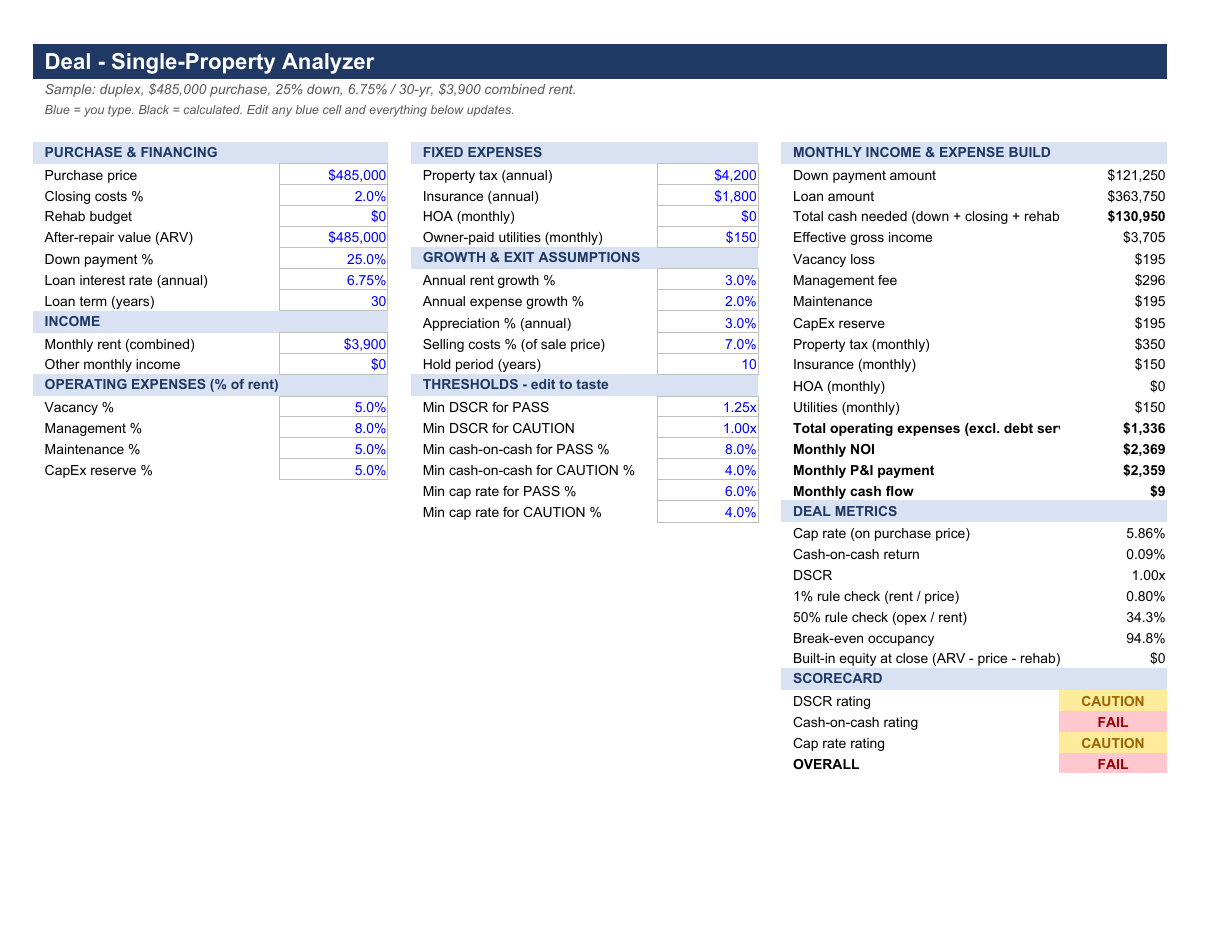
Deal tab: type into the blue cells and every other tab updates. It also checks the 1% and 50% rules and shows break-even occupancy.
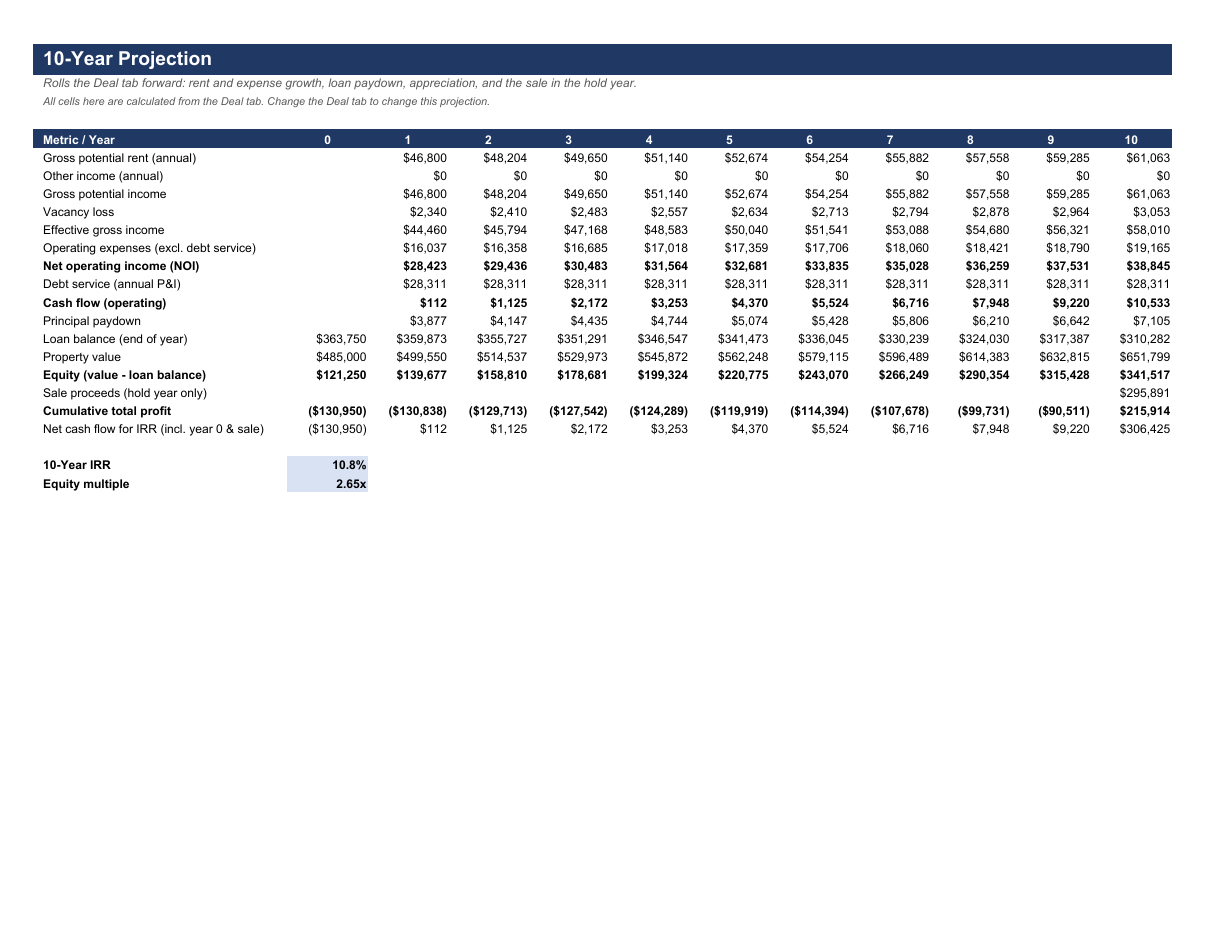
10-Year Projection tab: rent and expense growth, appreciation and loan paydown run year by year. You pick the sale year and it returns IRR and equity multiple.
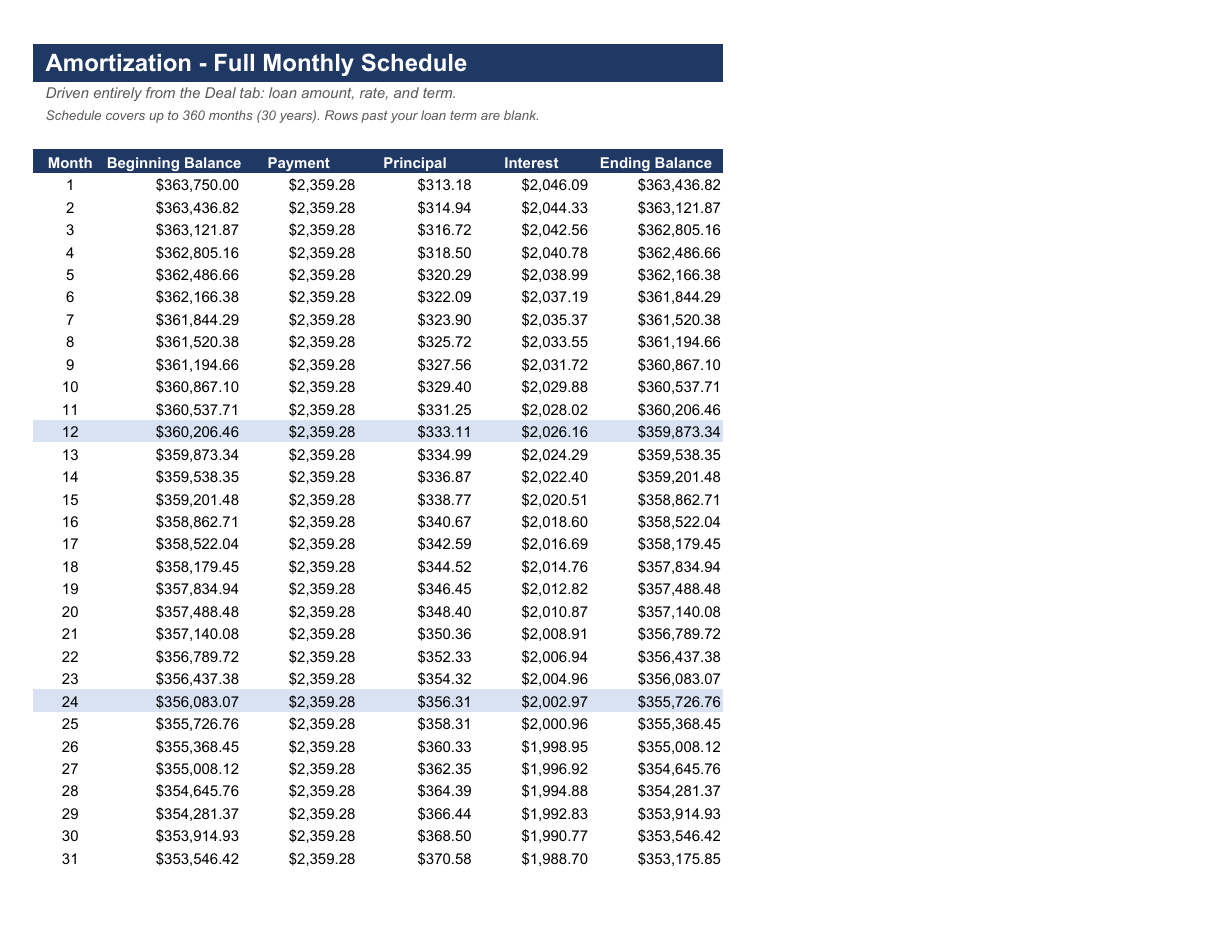
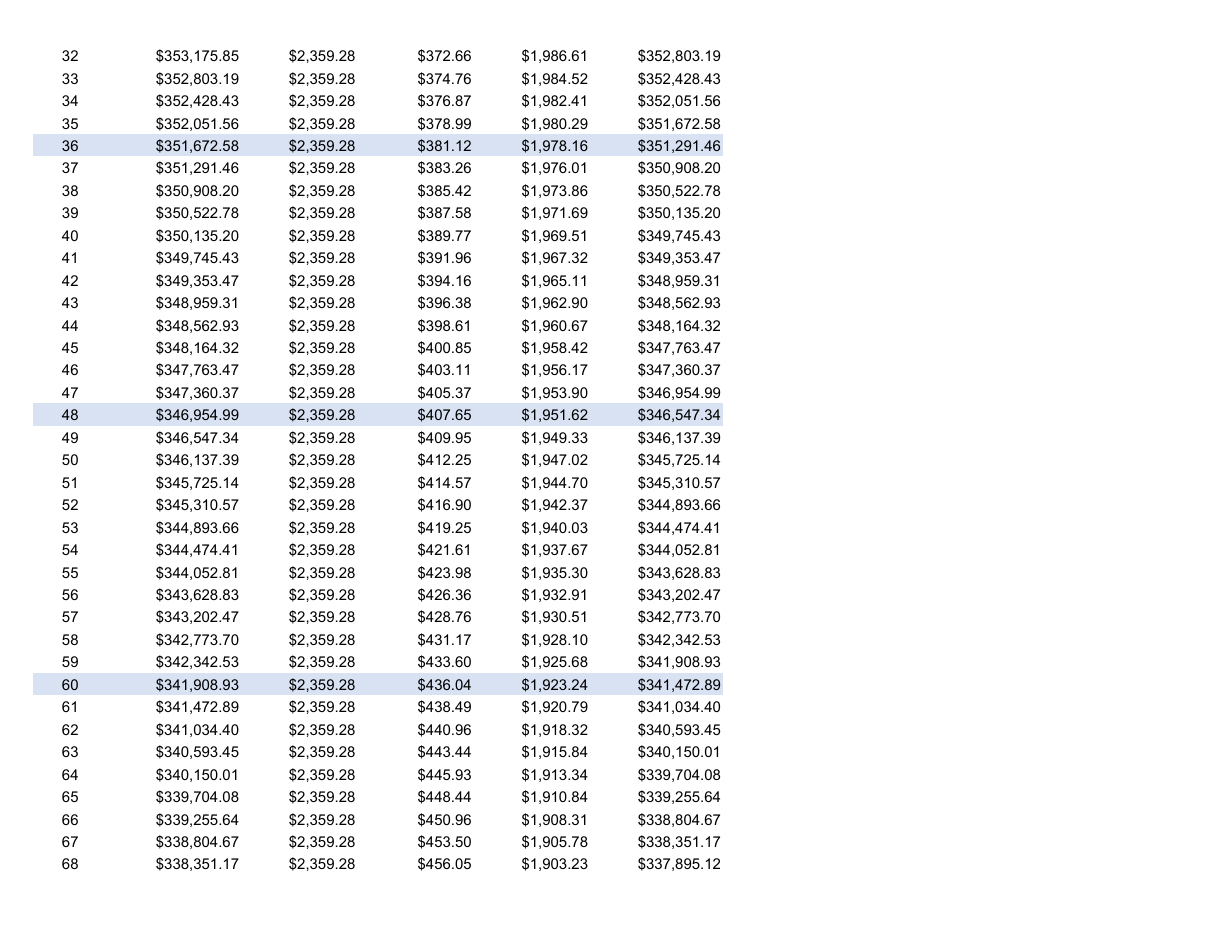
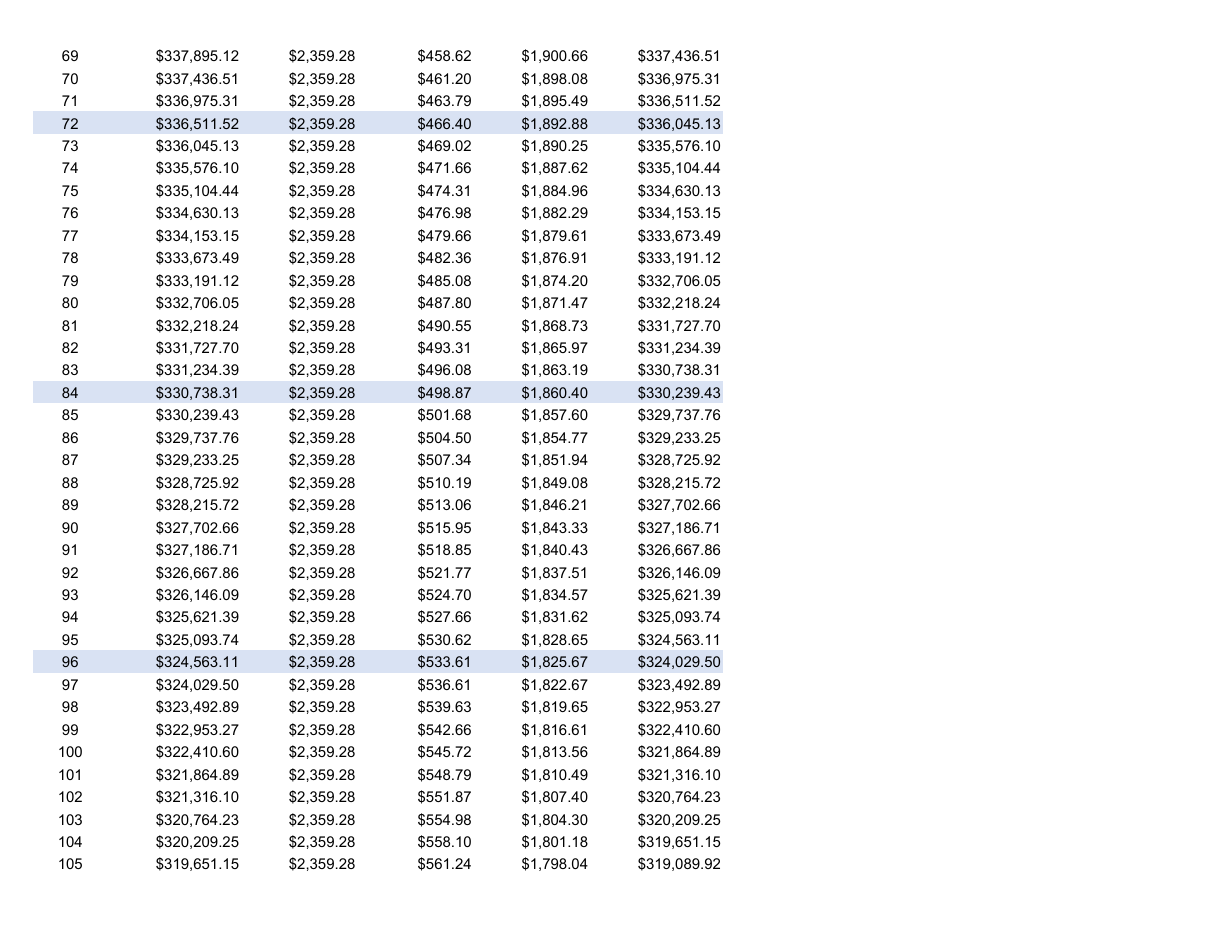
Amortization tab: the full loan schedule, month by month.
Compare tab: line up four properties side by side. The best value in each row is highlighted.
Charts: yearly cash flow, and equity against loan balance.
It is built for small landlords and house hackers. It opens with a sample duplex so you can see how it works first. The scorecard thresholds sit in their own block, so you can set your own bar for a good deal.
Every output is an open formula that you can click and trace. PMT drives the payment, CUMPRINC the paydown and IRR the return. Nothing is locked and there are no macros. Built with AI assistance and formula-checked.
Works in Excel, Google Sheets and LibreOffice Calc. You get one .xlsx file as an instant download. Nothing ships.
For education and planning only, not financial advice.
What is inside
- Start Here: one-screen guide with 5 steps, a color legend, and how the tabs fit together
- Deal: single-property analyzer with cash flow, cap rate, cash-on-cash, DSCR, 1% and 50% rule checks, break-even occupancy, and an editable PASS / CAUTION / FAIL scorecard
- 10-Year Projection: year-by-year rent, expenses, NOI, debt service, cash flow, principal paydown, loan balance, equity, property value, sale-year exit proceeds, cumulative profit, IRR, and equity multiple
- Amortization: full 360-month amortization schedule, formula-driven from the Deal tab
- Compare: up to 4 properties side by side with the best value in each row highlighted
- Charts: yearly cash flow and equity vs. loan balance, charted automatically from your numbers