Startup Financial Model (3-Statement, Driver-Based)
$59 · Excel (.xlsx), works in Google Sheets and Numbers
Buy for $59


Description
Show investors a model that ties out, not a page of guessed numbers. You enter customers, pricing, churn, headcount and costs in one place. The workbook builds all three statements from those drivers. The Balance Sheet balances in every year because nothing is plugged.
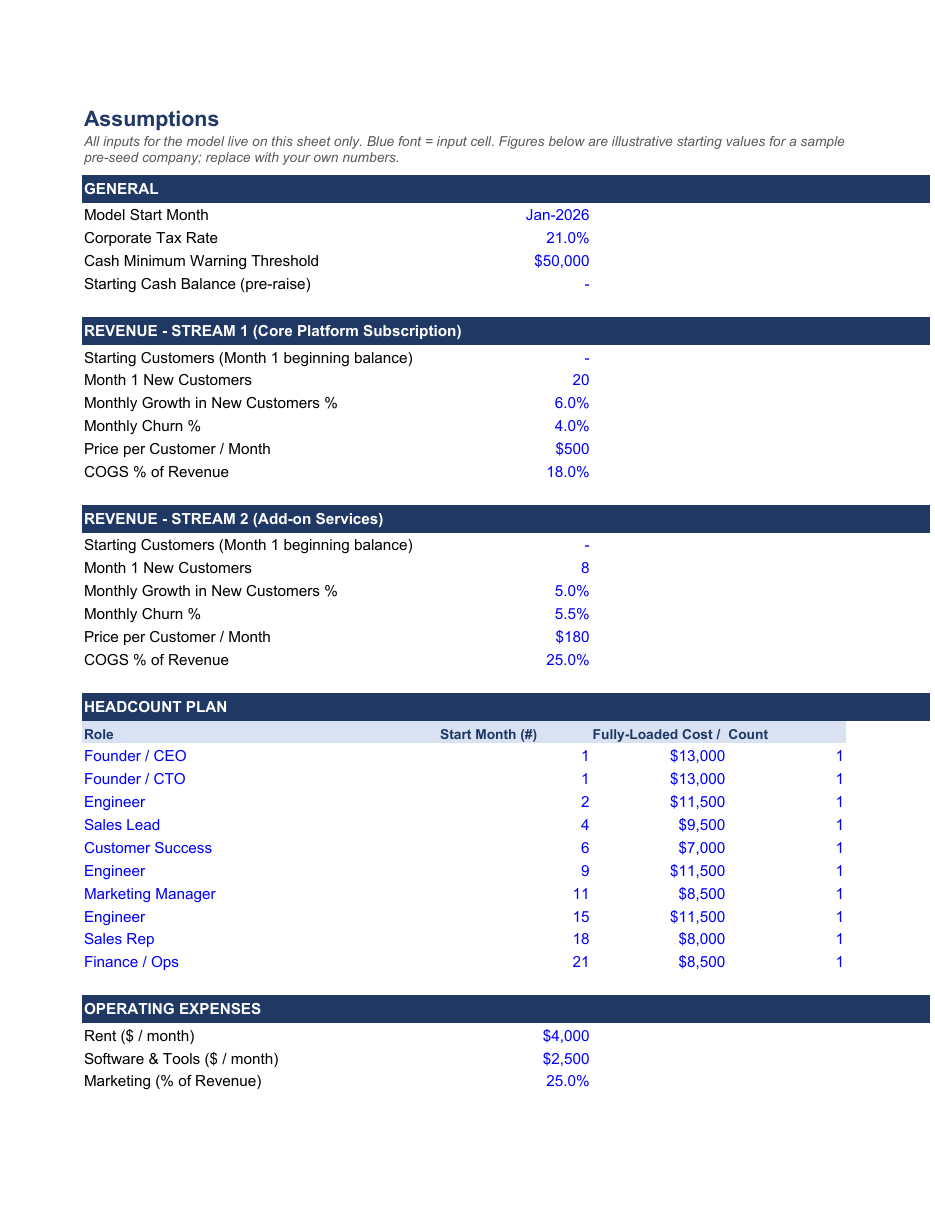
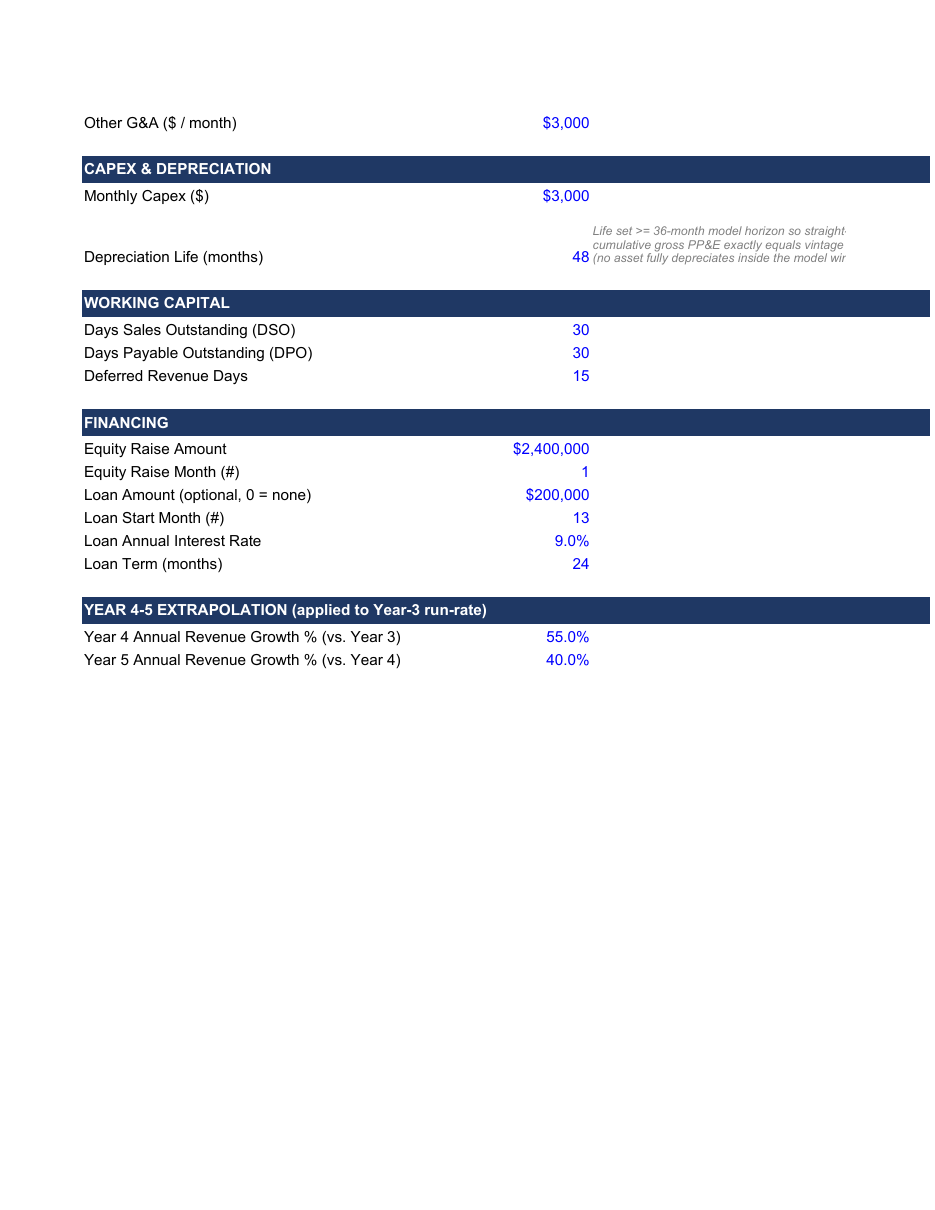
Assumptions tab: every input lives here, grouped by revenue, headcount, opex, capex, working capital and financing.
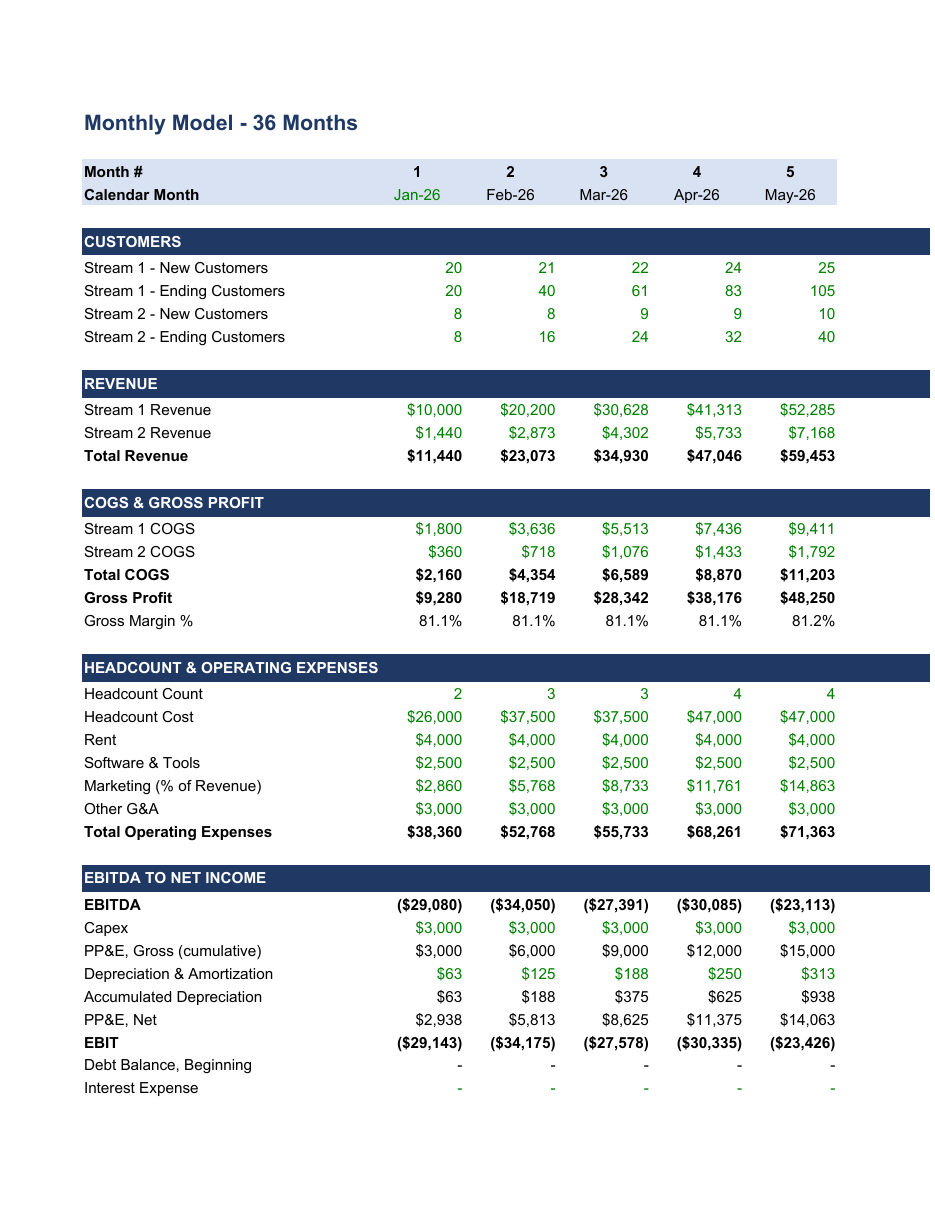
Monthly tab: a 36-month build from revenue down to ending cash. A flag warns you when cash runs low.
Annual tab: a 5-year Income Statement, Balance Sheet and Cash Flow Statement. A check row shows the Balance Sheet ties to 0.00 each year.
Unit Economics tab: CAC, LTV, LTV to CAC and payback period by year. CAC here counts the marketing budget only.
Runway and Raise tab: months of runway, the cash-out month and raise sizing. A 5x5 grid shows Year 3 revenue across growth and churn.
Charts: revenue by stream, ending cash and headcount, ready for a deck.
It is built for pre-seed and seed founders. It opens with a sample two-stream SaaS company that raises 2.4 million in month one, so you see a finished model first. Swap in your own numbers and every tab updates.
Every output is an open formula that you can click and trace. Blue cells are inputs, black cells are formulas and green cells link to other tabs. Nothing is locked and there are no macros. Built with AI assistance and formula-checked.
Built for Excel. You get one .xlsx file as an instant download. Nothing ships.
It is a planning template and does not replace a CPA, banker or lawyer. For education and planning only, not financial advice.
What is inside
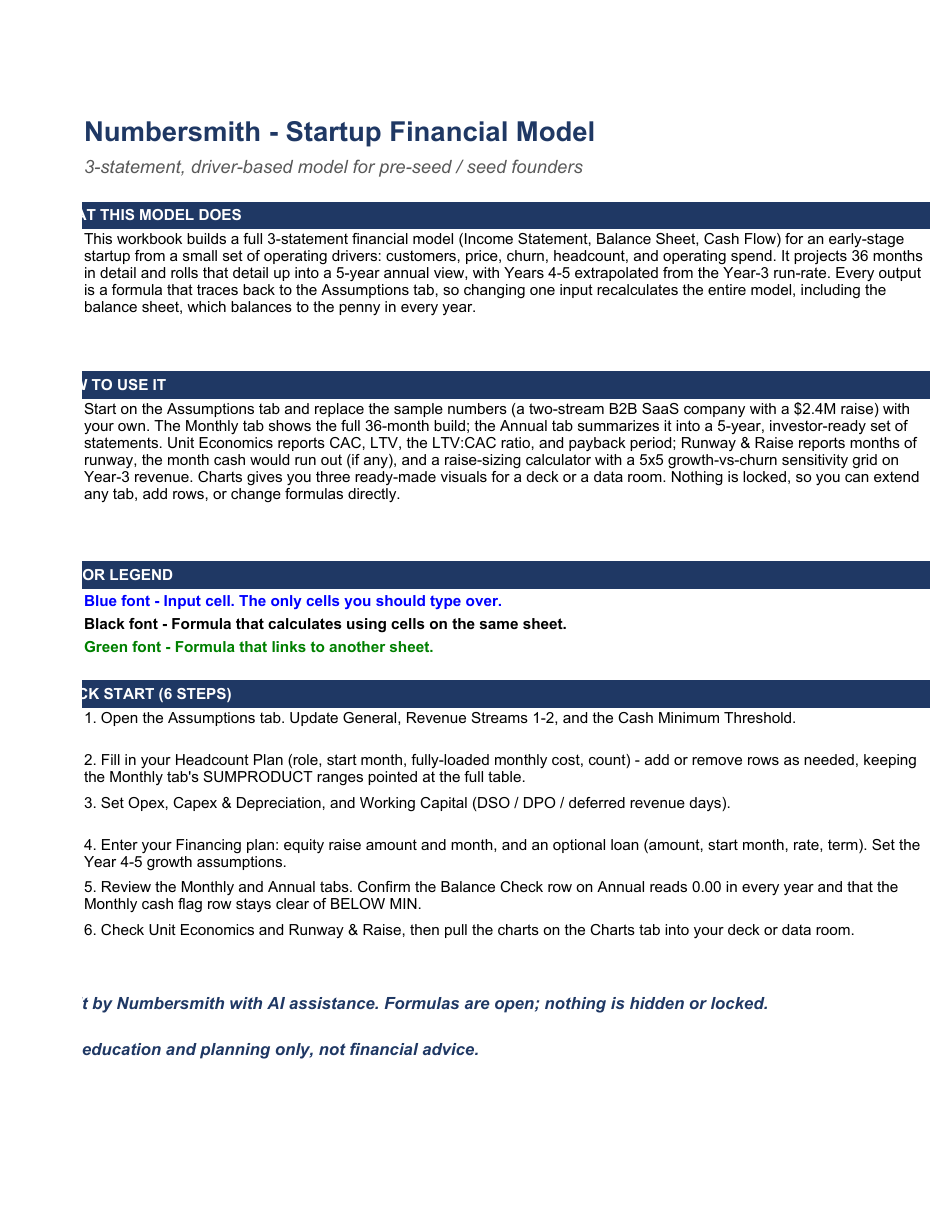
- README: what the model does, how to use it, color legend, 6-step quick start
- Assumptions: every input, grouped by General, Revenue, Headcount, Opex, Capex, Working Capital, Financing, and Year 4-5 growth
- Monthly: full 36-month build, revenue through ending cash, with a low-cash warning flag
- Annual: 5-year Income Statement, Balance Sheet, and Cash Flow Statement (Balance Sheet checks to 0.00 every year)
- Unit Economics: CAC, LTV, LTV to CAC ratio, and payback period by year
- Runway & Raise: runway, cash-out month, raise sizing, and a growth-vs-churn sensitivity grid
- Charts: native Excel charts for revenue by stream, ending cash, and headcount over time